The industrial revolution in the 18th century and the human activities such as burning of fossil fuels and deforestation have disturbed the natural equilibrium of the carbon cycle by adding 10 percent to the emissions. Apart from this, According to a report released by the World Meteorological Organization (WMO), in 2011 the amount of heat trapping carbon dioxide in the atmosphere had reached a record of 391 parts per million. But as per the new statistics produced by the Global Carbon Project, the emissions are set to rise again in 2012 reaching a record high of 35.6 billion tonnes.
The new figures indicate that global emissions from burning fossil fuels are now 58 percent above 1990 levels, which was the baseline year used in the Kyoto Protocol. That is the only global agreement in place that contains mandatory emissions reductions requirements. However, developing countries such as China and India do not have mandatory reductions under that agreement.
Some industrialized countries such as the U.S. have slowed, and in some cases reversed, their emissions growth recently due to the economic downturn and the increased use of natural gas for generating electricity (natural gas emits fewer greenhouse gases than coal-fired power plants). But those trends have been more than offset by the rapid growth in emissions from developing countries. In China, emissions grew by 9.9 percent in 2011, and in India emissions rose by 7.5 percent. That compares to an emissions decrease of 1.8 percent in the U.S., and 2.8 percent in the E.U. during the same period.
Emissions per person in China of 6.6 tonnes of CO2 were nearly as high as those of the European Union (7.3), but still below the 17.2 tonnes of carbon used in the U.S. Emissions in India were lower at 1.8 tonnes of carbon per person.
Although CO2 is still the most significant long-lived greenhouse gas, levels of other heat-trapping gases have also climbed to record levels, according to the report. Methane, for example hit 1,813 parts per billion (ppb) in 2011, and nitrous oxide rose to 324.2 ppb. The amount of excess heat prevented from escaping into outer space was 30 percent higher in 2011 than it was as recently as 1990.
During the 2009 U.N. climate negotiations in Copenhagen countries committed to a non-binding target of keeping global warming to under 2°C, or 3.6°F, compared to the pre-industrial levels. However, as the World Bank Report noted and the Global Carbon Project report also said, current emissions trends indicate that the world is on track for far more warming than that, perhaps as much as 7°F of warming by 2060. According to the climate scientists, the worst consequences of global warming may be unavoidable, such as several feet of sea level rise due to rapid melting of the Greenland and Antarctic ice sheets, along with more extreme weather events and harm to ocean ecosystems due to ocean acidification.
About Global Carbon Project:
The Global Carbon Project was formed to assist the international science community to establish a common, mutually agreed knowledge base supporting policy debate and action to slow the rate of increase of greenhouse gases in the atmosphere. The Global Carbon Project is responding to this challenge through a shared partnership between the International Geosphere-Biosphere Programme (IGBP), the International Human Dimensions Programme on Global Environmental Change (IHDP), the World Climate Research Programme (WCRP) and Diversitas. This partnership constitutes the Earth Systems Science Partnership (ESSP).
Showing posts with label REPORTS. Show all posts
Showing posts with label REPORTS. Show all posts
Friday, 7 December 2012

Tuesday, 4 December 2012
Bangalore better than Delhi, Mumbai in quality of living: Survey

Bangalore ranks better than New Delhi, Mumbai, Chennai and Kolkata amongst Indian cities in overall global quality of living index, according to a Mercer 2012 Quality of Living Survey.
Mercer conducts this survey annually to help multinational companies and other organisations compensate employees fairly when placing them on international assignments. According to the global consulting firm, its Quality of Living index list covers 221 cities, ranked against New York as the base city.
Global ranking by infrastructure
This year’s ranking separately identifies the cities with the best infrastructure based on electricity supply, water availability, telephone and mail services, public transportation, traffic congestion and the range of international flights from local airports, a statement said.
Singapore is at the top of this index, followed by Frankfurt and Munich. Copenhagen (4) and Dusseldorf (5) fill the next two slots, while Hong Kong and London share sixth place. Port-au-Prince (221) ranks at the bottom of the list.
Indian cities
Bangalore’s overall quality of living rank went up from 141 in 2011 to 139 in 2012 and is highest amongst other Indian cities. While New Delhi ranks (143), Mumbai (146), Chennai (150), and Kolkata (151) in overall Quality of living.
Bangalore’s rise in its quality of living ranking can be attributed to positive ratings for international schools which are suitable for expatriates, the survey says.
Mumbai ranks highest on city infrastructure category (134) amongst Indian cities followed by Kolkata (141), New Delhi (153), Chennai (168), and Bangalore (170).
Vienna retains top slot
In a statement issued here, Mercer said, Vienna retains the top spot as the city with the world’s best quality of living. Zurich and Auckland follow in the second and third place, respectively. Munich is in the fourth place, followed by Vancouver, which ranks fifth.
Düsseldorf dropped one spot to rank sixth followed by Frankfurt in seventh, Geneva in eighth, Copenhagen in ninth, and Bern and Sydney tied for the 10th place.
Asia-Pacific cities
Qualifying the Asia-Pacific cities, the survey says that Australian and New Zealand cities rank higher on the index with Sydney (11), Wellington (13), Melbourne (18) and Perth (21) following Auckland (3).
At the bottom
Globally, the cities with the lowest quality of living are Khartoum, Sudan (217); N’Djamena, Chad (218); Port-au-Prince, Haiti (219); and Bangui, Central African Republic (220). Baghdad, Iraq (221) ranks last.
Region-wise
Honolulu (28) is the city in the United States with the highest quality of living, followed by San Francisco (29) and Boston (35). Chicago is at 42 and Washington, DC ranks 43. New York, the base city, ranks 44.
In terms of city infrastructure, Vancouver (9) tops the ranking for the region with Atlanta and Montreal following at 13. In the United States, Dallas ranked 15, followed by Washington, DC (22), Chicago (28) and New York (30).
Europe has 15 cities among the world’s top 25 cities for quality of living. Vienna retains the highest-ranking for both the region and globally. With six cities in the top 10, European cities also fare well in the city infrastructure ranking.
Monday, 3 December 2012
Indian forests face threat from illegal encroachment: Govt
India's forests are not only facing threat from mining, they are also being ravaged due to illegal human encroachment.
According to a new government document, nearly 1.25 million hectares of ecologically fragile areas have been illegally occupied by humans.
Andhra Pradesh, Assam and Chhattisgarh are the worst culprits in this regard, the document says.
In Assam, 2,59,700 hectares of forest areas are under encroachment, while around 2,56,000 hectares of forest land in Andhra Pradesh has been illegally occupied by humans, it says.
An estimated 1,18,494 hectares of forest areas are under encroachment in Chhattisgarh where Maoist insurgents and legal and illegal mining in biodiversity hotspots are very active.
Forests in the Western Ghat region states, including Kerala, Karnataka, Maharashtra, Tamil Nadu and Gujarat are also under threat of encroachment.
Over 85,388 hectares of forests in Maharashtra have been illegally occupied, the document says.
Forest areas in Karnataka (96,014 hectares), Kerala (44,420 hectares), Gujarat (34,791 hectares) and Tamil Nadu (14,352 hectares) have been occupied by violators, it says.
Large-scale such violation of forests has been reported from many other states including Jammu and Kashmir (13,360 hectares), Odisha (78,505 hectares), Tripura (47,758 hectares), Arunachal Pradesh (58,553 hectares) and Uttar Pradesh (26,795 hectares).
Interestingly, not a single case of violation has been reported from Bihar. The data is prepared based on the information provided by the state governments in 2010 and 2011 and 2012.
The disclosure of violation of forest areas came at a time when the government is taking several steps to increase forest cover in 20 million hectares of land in 10 years under an ambitious programme called Green India Mission.
The Forest Survey conducted last year had revealed that India's forest cover has declined, with the maximum loss recorded in Andhra Pradesh. The reduction was to the tune of 367 square km in comparison to the 2009 assessment.
According to the biennial survey, the total forest and tree cover of the country is 78.29 million hectares, which is 23.81 per cent of the geographical area of the country.
Friday, 16 November 2012
India tops global pneumonia child deaths: UNICEF study
India tops in global pneumonia deaths of children under five years of age with 3.97 lakh reported in 2010, says a UNICEF study.
The third annual International Vaccine Access Center's (IVAC) Pneumonia Progress Report 2012 says that almost 1,088 children under 5 years of age die everyday in India, an increase of 6.7 per cent from 2008 IVAC data which pegged the deaths at 3.71 lakh annually.
Recent estimates from the United Nations Children's Fund (UNICEF) show that pneumonia continues to be the number one killer of children around the world - causing 18 per cent of all child mortality, an estimated 1.3 million child deaths in 2011 alone.
The Pneumonia Progress Report, 2012, released by IVAC and John Hopkins Bloomberg School of Public Health, says none of the 15 countries with high mortality due to pneumonia have reached the 90 per cent of WHO and Unicef's Global Action Plan for Prevention & Control of Pneumonia (GAPP) target for each intervention.
The report says India and Nigeria, the two large countries with highest numbers of child deaths worldwide, remain low scorers with an average intervention coverage rate of 55 per cent and 40 per cent, respectively.
The latest estimates on pneumonia mortality come in the wake of accelerated efforts to achieve the the Millennium Development Goal 4 of reducing under five child mortality by two thirds between 1990 and 2015 and gives a warning to India to speed up its vaccination efforts to prevent child deaths.
The report says that while India has made considerable stride in introducing hib vaccine in a few states, it still has much to do to strengthen its comprehensive approach to fighting pneumonia, including introduction of a pneumococcal conjugate vaccine as previously recommended by NTAGI in at least one state.
Bangladesh and Tanzania, formerly 12th and 14th in childhood pneumonia deaths, are no longer in the top 15, worldwide, and are replaced by Mali and the aggregated Sudan and South Sudan, the report adds.
Friday, 2 November 2012
second annual ‘Report to the People’ of National Innovation Council
The National Innovation Council presented its second Annual ‘Report to the People 2012’ to the President of India, Shri Pranab Mukherjee at the Rashtrapati Bhavan today (November 2, 2012). The Report was presented by the Chairman of the National Innovation Council and Adviser to the Prime Minister, Shri Sam Pitroda, in the presence of Shri Kapil Sibal, Union Minister for Communications and Information Technology. The Report highlights the activities and initiatives the Council has undertaken to strengthen the innovation eco system in the country. It builds on the previous work of the Council and outlines the new initiatives in the past year.
Wednesday, 31 October 2012
Global Prosperity Index 2012
The Legatum Prosperity Index is an annual ranking developed by the Legatum Institute of 142 countries. The ranking is based according to a variety of factors including wealth, economic growth, personal well-being, and quality of life. It is an attempt to broaden measurement of a nation’s economic health beyond indicators such as gross domestic product. The report shows that even amid the worst financial crisis since the Great Depression, global prosperity has increased across all regions in the past four years, although the sense of safety and security is decreasing amid tension in the Middle East and fear of crime in Latin America. Norway and Denmark retained the pole positions they held last year in the overall prosperity measure, while Sweden leapfrogged Australia and New Zealand into third. Canada, Finland, the Netherlands, Switzerland and Ireland rounded out the top ten. The Central African Republic was ranked bottom. In its sub-indexes, Legatum named Switzerland the strongest economy and home to the best system of governance. Denmark is the most entrepreneurial and New Zealand has the best education, while health is best in Luxembourg and Iceland is the safest. Canadians enjoy the most personal freedom and Norwegians have the greatest social capital. Plagued by the euro-area debt crisis, 24 out of 33 European nations have witnessed a decline in their economic score since 2009, according to Legatum. On the prosperity scale, Greece recorded the biggest drop in 2012, falling 10 places since 2009 to 49th. Spain held on to 23rd place. The U.K remained 13th, one place ahead of Germany, and Legatum predicted it will overtake the U.S. by 2014 as it scores well for entrepreneurship and governance. Nevertheless, the status of its economy remains a weakness as it slid five places to 26th on that score and job satisfaction is low. In Asia, Hong Kong, Singapore and Taiwan all ranked in the top ten for their economies and the top 20 overall. So-called tiger cub economies Vietnam and Indonesia also rose. Indonesia experienced the largest gain in prosperity of any country since 2009, jumping 26 positions to 63rd. Switzerland, Norway and Singapore topped the economy sub- index, which measures satisfaction with the economy and expectations for it, the efficiency of the financial sector and foundations for growth. In a gauge of entrepreneurship, Denmark ran ahead of Sweden and Finland for the strength of innovation and access to opportunity. Switzerland also topped the rankings for best government. It was followed by New Zealand and Denmark in a measure determined by the effectiveness and accountability of lawmakers, the fairness of elections, the participation of people in the political process and rule of law. The highest marks for education went to New Zealand, Australia and Canada. Luxembourg, the U.S. and Switzerland were graded the best for health treatments and infrastructure as well as preventative care and satisfaction with the service. Iceland, Norway and Finland topped the chart for safety and security; Chad, Congo and Afghanistan ranked the lowest on that index. Canadians, New Zealanders and Australians enjoy the most freedom and social tolerance, Legatum said. Norway, Denmark and Australia had the highest scores for social capital as monitored by social cohesion and family and community networks. |
Sunday, 21 October 2012
Delhi ranks last in world green index: UN report
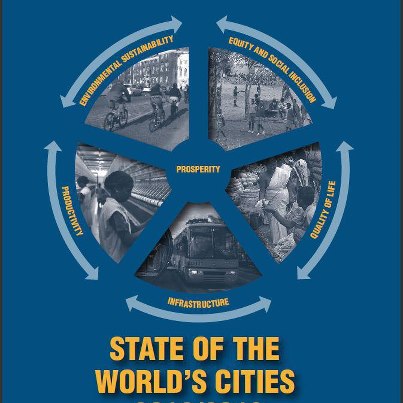
The latest United Nations report on world cities ranks the national capital virtually the lowest among 95 cities in the environment index.
The 'State of the World's Cities' report by UN Habitat released on October 17 has assessed the prosperity of the cities on various parameters such as productivity, quality of life and environment sustainability.
Delhi has scored only 0.448 (maximum is 1) in the last category, much less than even Dhaka and Kathmandu. Delhi's poor record in this segment has contributed to the lower ranking of the national capital at 58 among 95 select cities.
Acity will be considered to be environmentally sustainable, according to this report, when it values protection of the urban environment and natural assets while ensuring growth.
It should also be seeking ways to use energy more efficiently, minimize pressure on surrounding land and natural resources and minimize environmental losses by generating creative solutions to enhance the quality of environment.
The environmental sustainability index is made of three sub-indices - air quality (particulate matter10), CO2 emissions and indoor pollution.
"While Delhi has progressed a lot and urban infrastructure development has been significant, the pollution level here is higher than most of the other cities.
The huge increase in personal vehicles on Delhi's roads has been one of the major factors contributing to the deterioration in the ambient air quality of the captal. The city is also far behind Mumbai in the environment index.
In infrastructure development, however, it has left many cities, including Manila, Jakarta and Mumbai, far behind. "But what has gone against the Indian capital is its poor ranking in the productivity index.
Data shows that almost 7-8 in every 10 jobs created in Delhi are from the unorganized sector. People working in these sectors always fear losing jobs and that impacts productivity.
Friday, 12 October 2012
Global Hunger Report 2012 released- India ranked at 65th position
The report on Global Hunger Index for seventh year was released on 11 October 2012 by the International Food Policy Research Institute (IFPRI), Welthungerhilfe, and Concern Worldwide. The basic theme of the report for the 2012 Global Hunger Index -- The Challenge of Hunger: Ensuring Sustainable Food Security under Land, Water, and Energy Stresses.
IFPRI that calculated the global hunger Index analysed the measures based upon multidimensional angles. The published report have shown a proportional growth in hunger reduction of people worldwide but recorded the progress speed was tragically slow and alarming.
The report in its findings recorded twenty countries across the world mainly from South Asia and Sub-Saharan Africa to be highly alarming and have highest level of hunger, and showcased the sufferings of millions of poor.
As per the report, the nations that had showcased an absolute progress between 1990 Global Hunger Index to 2012 Global Hunger Index were Bangladesh, Angola, Malawi, Nicaragua, Ethiopia, Niger, and Vietnam. Whereas there are 15 countries that have managed to reduce it by 50 percent or more. As per the report, India instead of its fast paced economic growth in past two decades has lagged behind in improving its record in Global Hunger Index chart. In the list of 79 countries in the global Hunger Index, India was ranked 65th behind China that was placed at 2nd place position, Pakistan at 57th and Sri Lanka at 37th position.
The report also points out the three countries Bangladesh, India and Timor-Leste constitutes to the highest occurrence of underweight children under the age group of five years, which records to more than 40 percent in each country. India was ranked second with 43.5 percent of the children less than five underweight in the list of the 129 countries compared for underweight child, after Timor-Leste. Countries like Ethiopia, Niger, Nepal and Bangladesh followed the chart.
The report also complained about the lack and absence of an up-to-date data and information in case of India for the ineffectiveness of Indian Government’s nutrition relevant social programmes. India’s expenditure on Nutrition-related schemes for 2012-13 states that there is not a problem of resources in this case.
Subscribe to:
Posts (Atom)